When you gaze upward on a crystalline night, the celestial tapestry reveals itself not as a uniform scattering of white pinpricks but as a chromatic symphony spanning the electromagnetic spectrum. Stars manifest in hues ranging from deep crimson to brilliant azure, each color encoding fundamental information about stellar physics, evolutionary states, and the intricate mechanisms governing thermonuclear fusion. Understanding why stars exhibit such chromatic diversity requires examining the profound relationship between temperature, wavelength emission, and the quantum mechanical processes occurring within stellar atmospheres.
This chromatic variation is far from arbitrary decoration. Each stellar color represents a precise physical state, a thermal signature revealing the star’s surface temperature, chemical composition, age, and position along its evolutionary trajectory. The seemingly simple question of stellar coloration opens a gateway into understanding stellar classification systems, blackbody radiation principles, and the spectroscopic techniques that have revolutionized our comprehension of the cosmos. Through this exploration, we’ll decode the physical mechanisms that paint the night sky with its remarkable palette.
What Determines a Star’s Color?
The fundamental determinant of stellar coloration is surface temperature, a relationship governed by the principles of thermal radiation and blackbody physics. Stars function as approximately ideal blackbody radiators, objects that absorb all incident electromagnetic radiation and re-emit energy according to their temperature. This emission follows a precise mathematical relationship described by Planck’s law, which dictates the spectral distribution of radiated energy across wavelengths.
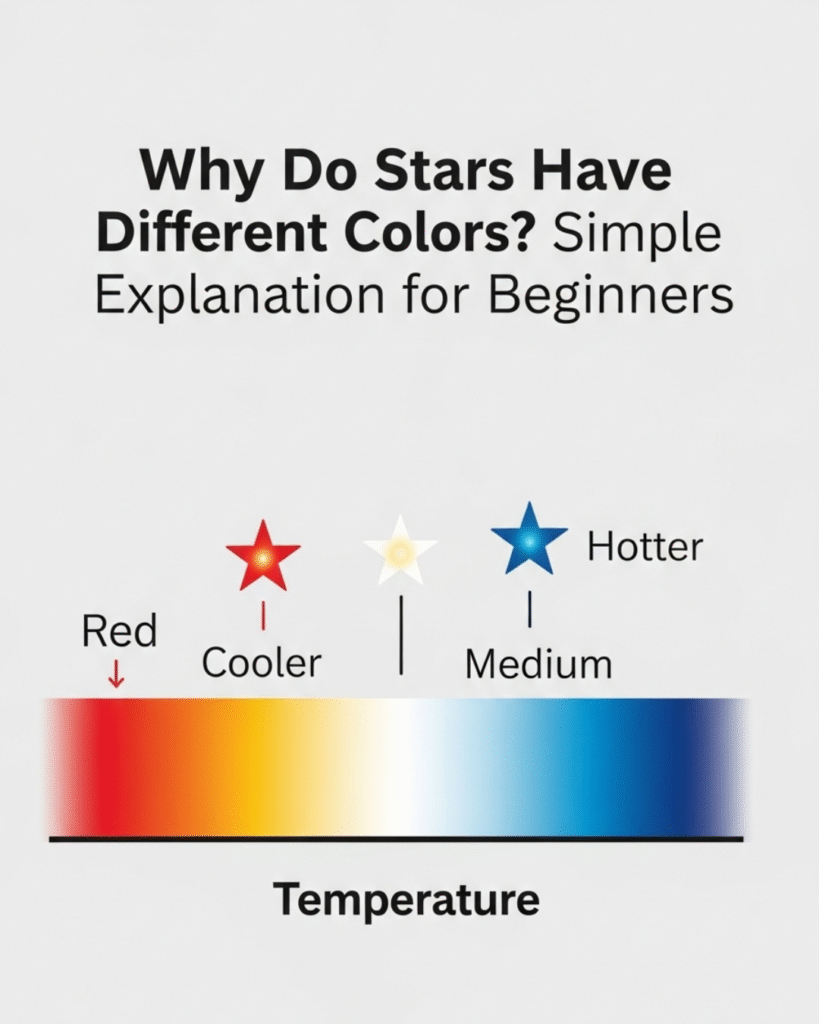
Wien’s displacement law provides the critical connection between temperature and color. This principle states that the peak wavelength of emission is inversely proportional to temperature. Mathematically expressed, the peak wavelength decreases as temperature increases, meaning hotter objects emit predominantly shorter wavelengths while cooler objects favor longer wavelengths. For stars, this translates directly into visible color: the hottest stars radiate most intensely in the blue and ultraviolet portions of the spectrum, while progressively cooler stars shift their peak emission toward red and infrared wavelengths.
The stellar photosphere, the visible surface layer from which light escapes into space, acts as the primary source of this thermal radiation. Within this relatively thin atmospheric shell, photons undergo their final interactions with stellar matter before beginning their journey across interstellar space. The temperature of this photosphere, typically ranging from approximately 2,500 Kelvin for the coolest red dwarfs to over 40,000 Kelvin for the most massive blue supergiants, establishes the characteristic spectral signature we perceive as color.
Beyond simple temperature considerations, stellar atmospheres introduce additional complexity through absorption and emission processes. Specific elements present in the photosphere create absorption lines at characteristic wavelengths, slightly modifying the continuous spectrum produced by blackbody radiation. These spectral fingerprints provide astronomers with detailed information about chemical composition, confirming that stellar coloration encodes not merely temperature but a comprehensive physical profile of the observed object.
How Does Temperature Create Different Stellar Colors?
The temperature-color relationship emerges from fundamental quantum mechanics and thermodynamics. Within a star’s photosphere, thermal energy continuously excites atoms and ions, causing electrons to transition between energy levels. When these excited electrons return to lower energy states, they emit photons with energies corresponding to specific wavelength transitions. The distribution of these emitted photons across the electromagnetic spectrum depends critically on the thermal energy available, which is directly proportional to temperature.
Consider a relatively cool red star with a surface temperature around 3,000 Kelvin. At this temperature, the peak of the blackbody emission curve falls in the red portion of the visible spectrum, approximately 900 nanometers. While the star emits radiation across all wavelengths, the intensity distribution strongly favors longer wavelengths. Our eyes, integrating this spectral information, perceive the dominant red component, though significant infrared emission remains invisible to human vision. The star appears red not because it exclusively emits red light, but because red wavelengths dominate its spectral output.
Contrast this with a blue star possessing a surface temperature of 25,000 Kelvin. Wien’s displacement law predicts that peak emission occurs around 115 nanometers, deep in the ultraviolet region beyond human visual perception. However, the emission curve extends significantly into the visible spectrum, with substantial intensity in blue and violet wavelengths. The integrated visual perception emphasizes these shorter wavelengths, creating the characteristic blue appearance. Importantly, blue stars emit vastly more total energy than red stars, a consequence of the Stefan-Boltzmann law, which states that total radiated power scales with the fourth power of temperature.
The intermediate temperature range produces stars that appear white or yellow. Our Sun, with a surface temperature of approximately 5,800 Kelvin, exhibits peak emission in the green portion of the spectrum around 500 nanometers. However, the broad emission curve spans the entire visible range relatively uniformly, and the human visual system’s integrated response interprets this balanced spectrum as white or slightly yellow. This demonstrates that perceived color depends not only on the physical emission spectrum but also on the physiological response characteristics of human vision.
The enormous temperature range observed among stars reflects fundamental differences in mass, which governs the rate of thermonuclear fusion in stellar cores. More massive stars maintain higher core temperatures and pressures, driving more vigorous fusion reactions that generate greater energy output. This enhanced energy generation propagates outward, establishing higher photospheric temperatures and correspondingly bluer colors. Lower-mass stars burn their nuclear fuel more conservatively, maintaining cooler surfaces and redder appearances while potentially surviving far longer than their massive, rapidly-burning blue counterparts.
Which Factors Beyond Temperature Affect Stellar Color?
While temperature dominates stellar coloration, several additional factors introduce subtle but scientifically significant variations. Interstellar extinction represents one such phenomenon, occurring when starlight traverses dust-laden regions of space. Microscopic dust particles preferentially scatter shorter wavelengths through a process called Rayleigh scattering, the same mechanism that renders Earth’s sky blue. Consequently, distant stars often appear redder than their intrinsic color would suggest, a phenomenon astronomers term “interstellar reddening.”
This reddening effect poses both challenges and opportunities for astronomical research. On one hand, it complicates direct temperature determination from observed colors, requiring correction factors based on estimated dust column density along the line of sight. On the other hand, the magnitude of reddening provides valuable information about the distribution and properties of interstellar medium constituents. Sophisticated spectroscopic techniques allow astronomers to disentangle intrinsic stellar colors from extinction effects, recovering accurate physical parameters.
Chemical composition introduces another layer of complexity, particularly for stars with unusual abundances of specific elements. While temperature sets the fundamental spectral energy distribution, strong absorption lines from particular elements can redistribute intensity across wavelengths. Metal-poor stars, those deficient in elements heavier than helium, exhibit subtly different spectral characteristics compared to metal-rich stars at the same temperature. These differences, while small, provide crucial insights into stellar formation history and galactic chemical evolution.
Stellar rotation and magnetic activity also influence observed spectra, though these effects typically require high-resolution spectroscopy to detect. Rapidly rotating stars exhibit line broadening due to Doppler shifts from material moving toward and away from observers. Strong magnetic fields can split spectral lines through the Zeeman effect, revealing information about magnetic field strengths and geometries. While these phenomena don’t dramatically alter perceived color, they demonstrate the rich information content encoded in stellar light beyond simple hue.
Binarity and multiplicity introduce additional considerations. In close binary systems, stars may exchange material, altering surface compositions and temperatures. Eclipsing binaries periodically change their integrated color as different stellar surfaces become visible. These dynamic systems provide unique laboratories for testing stellar physics under extreme conditions, with color variations serving as sensitive diagnostics of orbital parameters and mass transfer rates.
What Is the Stellar Classification System Based on Color?
Astronomers have developed sophisticated classification schemes to organize stellar diversity, with the Harvard spectral classification representing the foundational framework. This system arranges stars into spectral types designated by letters: O, B, A, F, G, K, and M, progressing from hottest to coolest. A mnemonic device traditionally used by astronomers helps memorize this sequence, though the physical basis lies in systematic temperature variations and corresponding spectral characteristics.
O-type stars, the hottest and rarest, exhibit surface temperatures exceeding 30,000 Kelvin and appear intensely blue to human observers. Their spectra show prominent ionized helium lines alongside highly ionized metals, signatures of the extreme conditions in their photospheres. These massive, luminous objects burn through their nuclear fuel rapidly, existing for mere millions of years before catastrophic supernova explosions. Stars like Naos in the constellation Puppis exemplify this extreme stellar class.
B-type stars, only slightly cooler with temperatures between 10,000 and 30,000 Kelvin, maintain brilliant blue-white appearances. Their spectra display neutral helium lines and increasingly prominent hydrogen absorption features. Rigel in Orion represents a well-known B-type supergiant, its azure luminosity visible across vast interstellar distances. These stars, while less extreme than O-types, still represent massive, short-lived objects that dominate the luminosity of young stellar populations.
A-type stars occupy the temperature range from 7,500 to 10,000 Kelvin, appearing white to casual observation. Their defining spectral characteristic is strong hydrogen absorption lines, particularly the Balmer series. Sirius, the brightest star in Earth’s night sky, exemplifies this class with its dazzling white brilliance. Vega in Lyra provides another prominent example, serving as a historical standard for photometric calibration.
F-type stars bridge the gap between hot white stars and cooler yellow stars, with temperatures from 6,000 to 7,500 Kelvin. Their spectra begin showing weaker hydrogen lines alongside emerging metallic absorption features from ionized calcium and other elements. Procyon in Canis Minor represents this intermediate class, appearing white with subtle yellow tinges to sensitive observers.
G-type stars, including our Sun, span temperatures from 5,200 to 6,000 Kelvin and appear distinctly yellow. Their spectra show prominent ionized calcium H and K lines alongside numerous metallic absorption features. These stars occupy a sweet spot for planetary habitability, maintaining stable luminosities over billions of years while emitting substantial energy in wavelengths favorable for photosynthetic life. Alpha Centauri A, our nearest stellar neighbor, shares the Sun’s G-type classification.
K-type stars, with temperatures from 3,700 to 5,200 Kelvin, appear orange to human vision. Their spectra become increasingly complex, dominated by neutral metallic lines and emerging molecular bands from simple compounds. Arcturus in Boötes exemplifies this class as one of the brightest K-type giants visible from Earth. These long-lived stars have attracted recent attention as potential hosts for habitable exoplanets due to their stability and longevity.
M-type stars represent the coolest and most abundant stellar class, with temperatures below 3,700 Kelvin producing distinctive red hues. Their spectra show strong molecular absorption bands from titanium oxide and other compounds, creating complex spectral signatures. Betelgeuse in Orion demonstrates an M-type supergiant’s deep red coloration, while Proxima Centauri exemplifies the faint M-dwarf stars that comprise the majority of stellar population. These dim, cool objects can survive for trillions of years, far exceeding the current age of the universe.
How Do Astronomers Measure Stellar Colors Precisely?
Modern astronomical techniques employ sophisticated photometric and spectroscopic methods to quantify stellar colors with remarkable precision. The foundational approach uses standardized filter systems that isolate specific wavelength ranges, with the Johnson-Cousins UBVRI system representing the most historically significant photometric standard. These filters transmit light in ultraviolet, blue, visual, red, and infrared bands respectively, allowing astronomers to construct color indices that characterize spectral energy distributions.
Color indices, typically expressed as magnitude differences between filter bands, provide temperature-sensitive measurements independent of stellar distance. The B-V color index, calculated by subtracting visual magnitude from blue magnitude, serves as a primary temperature indicator. Hot blue stars exhibit negative B-V values as they appear brighter in blue than visual wavelengths, while cool red stars show positive values. This simple metric allows astronomers to estimate temperatures without detailed spectroscopic analysis.
Spectroscopy revolutionized stellar studies by dispersing light into constituent wavelengths, revealing detailed absorption and emission line patterns. Modern spectrographs attached to large telescopes achieve resolving powers exceeding 100,000, distinguishing wavelength differences of mere thousandths of a nanometer. This capability enables precise measurement of line strengths, widths, and positions, from which astronomers derive temperatures, compositions, velocities, and other physical parameters with extraordinary accuracy.
Space-based observatories have transformed stellar photometry by eliminating atmospheric interference that distorts ground-based measurements. Missions like Gaia have measured precise colors and positions for over a billion stars, creating unprecedented three-dimensional maps of galactic structure. These data sets enable statistical studies of stellar populations, tracing galactic chemical evolution and testing theoretical models of stellar formation and evolution with unprecedented rigor.
Advanced techniques like interferometry push measurement precision even further, directly resolving stellar disks and measuring temperature variations across stellar surfaces. The CHARA Array and other ground-based interferometers have imaged surface features on nearby giants, revealing temperature inhomogeneities, stellar spots, and asymmetries that influence integrated colors. These cutting-edge observations bridge the gap between distant point sources and resolved, physically understood objects.
What Does Stellar Color Reveal About Stellar Evolution?
Stellar coloration provides a temporal dimension to astronomical observation, encoding information about a star’s age and evolutionary state. The Hertzsprung-Russell diagram, plotting stellar luminosity against temperature or color, reveals the life trajectories of stars as they exhaust nuclear fuels and undergo structural transformations. Main sequence stars, actively fusing hydrogen in their cores, form a diagonal band across this diagram, with position determined primarily by mass.
As stars exhaust core hydrogen, they depart the main sequence and evolve toward the red giant phase. Increasing core temperatures drive hydrogen fusion into surrounding shells, causing outer layers to expand dramatically. This expansion increases surface area while maintaining roughly constant luminosity, necessarily decreasing surface temperature according to the Stefan-Boltzmann law. The star’s color shifts dramatically redward, transforming from white or yellow to orange and finally deep red as it swells to hundreds of times its original radius.
The subsequent evolution depends critically on initial mass. Low to intermediate mass stars like the Sun will eventually shed their distended envelopes, exposing hot, dense white dwarf cores. These stellar remnants initially appear blue-white due to surface temperatures exceeding 100,000 Kelvin, then gradually cool and redden over billions of years as they radiate away their thermal energy. White dwarfs represent stellar endpoints, no longer generating energy through fusion but slowly dissipating residual heat into the cosmic background.
Massive stars follow more dramatic evolutionary paths, progressing through multiple fusion stages and color changes before explosive supernova deaths. These stars may cycle through blue, yellow, and red phases multiple times as different nuclear fuels ignite in their cores and envelope structures respond. Blue supergiants like Rigel represent one possible phase, while red supergiants like Betelgeuse exemplify another. The final color before core collapse provides clues about envelope retention and mass loss history.
Variable stars demonstrate color changes on human timescales, providing real-time laboratories for studying stellar physics. Cepheid variables oscillate in luminosity and temperature with periods from days to months, their surfaces rhythmically expanding and contracting. These pulsations cause detectable color variations as temperature oscillates, with stars appearing bluer at maximum luminosity and redder at minimum. This behavior serves dual purposes, revealing internal stellar structure through asteroseismology while providing standardized cosmic distance indicators.
Which Role Does Stellar Mass Play in Color Determination?
Stellar mass emerges as the fundamental parameter governing stellar properties throughout the life cycle, with color representing one visible manifestation of mass-dependent physics. The mass-luminosity relationship, established through binary star observations, demonstrates that luminosity scales approximately as the fourth power of mass for main sequence stars. This steep dependence means massive stars generate vastly more energy than low-mass counterparts, requiring higher surface temperatures to radiate this enhanced power.
The physical mechanism connecting mass to temperature operates through hydrostatic equilibrium, the balance between gravitational compression and internal pressure support. More massive stars possess stronger gravitational fields requiring higher internal pressures to resist collapse. These elevated pressures necessitate higher temperatures, as pressure relates directly to temperature through the ideal gas law in stellar interiors. Enhanced core temperatures drive more vigorous fusion reactions, generating the energy that ultimately determines photospheric temperature and color.
Brown dwarfs illustrate the lower mass boundary where stellar physics transitions to planetary phenomena. These substellar objects, with masses below approximately 80 Jupiter masses, never achieve sufficient core temperatures to sustain hydrogen fusion. Consequently, they continue cooling throughout their existence, progressively reddening as surface temperatures decline. The coolest brown dwarfs exhibit temperatures below 500 Kelvin, appearing nearly invisible in optical wavelengths while radiating primarily in infrared. These objects blur traditional distinctions between stars and planets, occupying a unique niche in the cosmic mass spectrum.
At the upper mass extreme, stellar instability limits maximum sizes. Stars exceeding roughly 150 solar masses become unstable to radiation pressure, potentially disrupting themselves through violent mass loss episodes. The most massive observed stars, like R136a1 in the Large Magellanic Cloud, exhibit extreme temperatures exceeding 50,000 Kelvin and appear intensely blue. These behemoths live fast and die young, exhausting their nuclear fuel in mere millions of years before catastrophic supernova explosions that enrich the interstellar medium with heavy elements.
Binary star systems provide natural laboratories for investigating mass-color relationships under controlled conditions. When two stars form simultaneously from the same molecular cloud, they share identical ages and initial compositions, isolating mass as the primary variable. Observations of such systems confirm theoretical predictions, demonstrating how mass alone determines position on the main sequence and corresponding color. Wide binaries preserving their birth separations offer particularly clean tests, while close binaries introduce complications from tidal interactions and mass transfer.
How Has Our Understanding of Stellar Colors Advanced Through History?
The intellectual journey toward understanding stellar coloration spans millennia, from ancient observations to modern astrophysical theory. Early cultures recognized color differences among bright stars, with Greek astronomers like Ptolemy documenting rudimentary color classifications. However, the physical basis remained mysterious until the development of thermodynamics and spectroscopy in the nineteenth century.
William Herschel’s pioneering infrared discoveries in 1800 established that radiant heat and visible light represented continuous phenomena, laying groundwork for understanding thermal radiation. Josef von Fraunhofer’s subsequent identification of absorption lines in solar spectra opened the era of stellar spectroscopy, revealing that stars possessed analyzable chemical compositions and physical properties. These developments transformed astronomy from positional measurement to physical investigation.
Gustav Kirchhoff and Robert Bunsen’s spectroscopic work in the 1850s established the connection between chemical elements and characteristic spectral lines, enabling composition determination from remotely observed light. This breakthrough demonstrated that stellar spectra encoded detailed physical information, motivating systematic spectroscopic surveys. The Harvard College Observatory’s ambitious program, led by Edward Pickering and executed largely by women “computers” including Annie Jump Cannon, classified hundreds of thousands of stellar spectra, establishing the foundational classification scheme still used today.
Ejnar Hertzsprung and Henry Norris Russell independently discovered the relationship between stellar luminosity and spectral type in the early twentieth century, creating the diagnostic diagram that bears their names. This Hertzsprung-Russell diagram revealed that stars did not randomly populate the luminosity-temperature plane but concentrated along specific sequences, strongly suggesting evolutionary relationships. This insight transformed stellar astronomy from cataloging diversity to understanding physical processes and life cycles.
The quantum revolution of the 1920s provided theoretical foundations for understanding stellar spectra and colors. The development of quantum mechanics explained atomic structure and spectral line formation, while Arthur Eddington’s work on stellar structure established the mass-luminosity relationship. Cecilia Payne-Gaposchkin’s 1925 doctoral thesis demonstrated that stars consisted primarily of hydrogen and helium, overturning previous assumptions about cosmic composition and providing crucial insights into stellar energy generation.
Modern computational astrophysics has refined and extended these classical insights. Sophisticated stellar evolution codes track nuclear reactions, energy transport, and structural changes over billions of years, predicting observable properties including colors at each evolutionary stage. These theoretical models, constantly refined through comparison with observations from space and ground-based telescopes, provide comprehensive frameworks for interpreting stellar colors as signatures of underlying physical processes.
What Future Discoveries Await in Stellar Color Research?
Contemporary astronomical instrumentation promises unprecedented insights into stellar physics through ever more precise color measurements and analyses. The James Webb Space Telescope, with its infrared capabilities, reveals previously hidden cool stellar populations, including the coldest brown dwarfs and heavily obscured young stars. These observations expand the known temperature range and test theoretical models under extreme conditions impossible to reproduce terrestrially.
Extremely Large Telescopes under construction, including the European Extremely Large Telescope and the Thirty Meter Telescope, will achieve unprecedented spatial and spectral resolution. These instruments will enable detailed study of stellar surfaces, resolving temperature variations across stellar disks and revealing the physical processes driving chromospheric activity, stellar spots, and convection patterns. Understanding these phenomena refines color predictions and tests stellar atmosphere models with new rigor.
Asteroseismology, the study of stellar oscillations, provides complementary insights into stellar interiors and evolutionary states. Space missions like TESS and upcoming PLATO detect subtle brightness variations caused by acoustic waves propagating through stellar interiors. The frequencies of these oscillations encode information about internal structure, allowing astronomers to determine ages, masses, and evolutionary states with extraordinary precision. Combined with color measurements, asteroseismic data constrain stellar models more tightly than ever before.
Exoplanet studies increasingly recognize the importance of host star properties, including color and spectral energy distribution, for determining planetary habitability. The wavelength distribution of incident stellar radiation affects atmospheric chemistry, surface temperatures, and photosynthetic potential for hypothetical life. Detailed characterization of stellar colors across the electromagnetic spectrum informs assessments of which planetary systems merit intensive study in the search for biosignatures.
Galactic archaeology, reconstructing the Milky Way’s formation history through stellar populations, relies heavily on color-magnitude diagrams of resolved stellar populations. Future surveys will extend these analyses to increasingly distant and faint stars, tracing chemical evolution and star formation history across cosmic time. The colors of ancient, metal-poor stars provide windows into conditions in the early universe, revealing the properties of the first stellar generations.
Conclusion
Stellar coloration represents far more than aesthetic variation in the night sky. Each hue encodes precise physical information about temperature, composition, evolutionary state, and fundamental properties governed by mass and nuclear physics. From the coolest red dwarfs barely radiating visible light to blue supergiants burning with ferocious intensity, the chromatic diversity of stars reveals the rich tapestry of stellar physics and cosmic evolution.
Understanding why stars exhibit different colors requires integrating concepts from thermodynamics, quantum mechanics, nuclear physics, and observational astronomy. The temperature-color relationship, grounded in blackbody radiation and Wien’s displacement law, provides the foundational explanation, while additional factors including chemical composition, interstellar extinction, and evolutionary state introduce subtle variations. The Harvard spectral classification system organizes this diversity into a coherent framework, enabling systematic study of stellar populations and evolutionary processes.
Modern astronomical techniques, from multi-wavelength photometry to high-resolution spectroscopy and interferometry, provide increasingly precise measurements of stellar colors and the physical parameters they encode. Space-based observatories eliminate atmospheric distortions, while extremely large ground-based telescopes achieve unprecedented resolution. These advancing capabilities, combined with sophisticated theoretical models, continue refining our understanding of stellar physics and evolution.
The intellectual journey from ancient color observations to contemporary astrophysical theory demonstrates the power of scientific methodology in decoding natural phenomena. Each generation of astronomers has built upon previous insights, progressively revealing the physical principles governing stellar behavior. As technology advances and theoretical understanding deepens, stellar colors will continue revealing new insights into the cosmos, guiding our exploration of the universe and our place within it.